

John Day Fossil Beds National Monument—climate
My previous post about paleontology explored how plants and animals changed during the 44-million-year time period represented in the John Day Fossil Beds. The evolution of species, in general, occurs because species eventually become extinct and new species arise to take their places. Today, human activities are contributing to organisms’ extinction, but there are many natural factors that have caused organisms to go extinct throughout geologic time.
What causes extinction? Extinction occurs when species are diminished because of environmental factors such as habitat loss, climate change, and natural disasters like volcanic eruptions. Biological factors such as genetic inbreeding and poor reproduction can also lead to extinction.
A recent article in the New York Times provides new data about the end-Triassic extinction: https://www.nytimes.com/2021/09/27/science/dinosaurs-volcanoes-triassic.html. The John Day Fossils Beds were deposited during the Cenozoic Era (past 66 million years), but extinctions have occurred continually during all time periods, just at a slower rate referred to as background extinction.
Biostratigraphy
The evolution of species is the essential element of biostratigraphy, which means using fossils to establish the relative age of rocks and to correlate separated sedimentary sequences. (See my first post about the Fossil Beds for an explanation of stratigraphy: https://landscapes-revealed.net/john-day-fossil-beds-national-monument-stratigraphy/.) Fossils are called relative dating methods because they don’t provide numerical ages. Rather, data from other geologic features, such as ash or lava beds, are needed to obtain the numerical ages that define the time period of a species’ existence on Earth—a period called a species’ range.

This hypothetical scenario (from https://www.dodea.edu/index.cfm) shows eight species’ ranges—the length of each white arrow. There are no numbers on the vertical axis, which was the situation before the 1950s when scientists developed dating methods based on the radiometric decay of isotopes. Early geologists could tell the relative age (i.e., what is younger and what is older), but not the numerical age. Now imagine that the thick horizontal green lines are volcanic ash layers that provide numerical ages of 15 Ma (lower one) and 13 Ma (upper one). You could then bracket the age of two fossil types to the 15–13 Ma time period. Then you could also go to other locations and if you found these same fossils, you would know their age. (Ma=millions of years ago)
Some fossils are particularly useful and are referred to as index fossils. To be a good index fossil, an organism’s remains must be easily recognizable, abundant, and have a wide geographic distribution and a short range through time. Looking at the diagram above, the bottom tip of an arrow is when a species first appeared on Earth, and the top tip of an arrow is when the species became extinct. We would conclude that the two middle fossils, with the shortest range, would make the best index fossils, assuming that they lived in a large enough geographical region to be useful in many places.
Turning back to the John Day Fossil Beds, we can understand why the fossil record there is so important. Because of the numerous ash and lava beds, it is possible to tightly constrain the age range of many species. Oreodont species, for example, evolved throughout the time represented in the Fossil Beds. The age range of each species can be determined and, since oreodonts lived throughout North America, the numerical ages obtained at John Day can be used to establish the age of these same oreodont species that lived in other localities.
Climate change and evolution in the John Day region
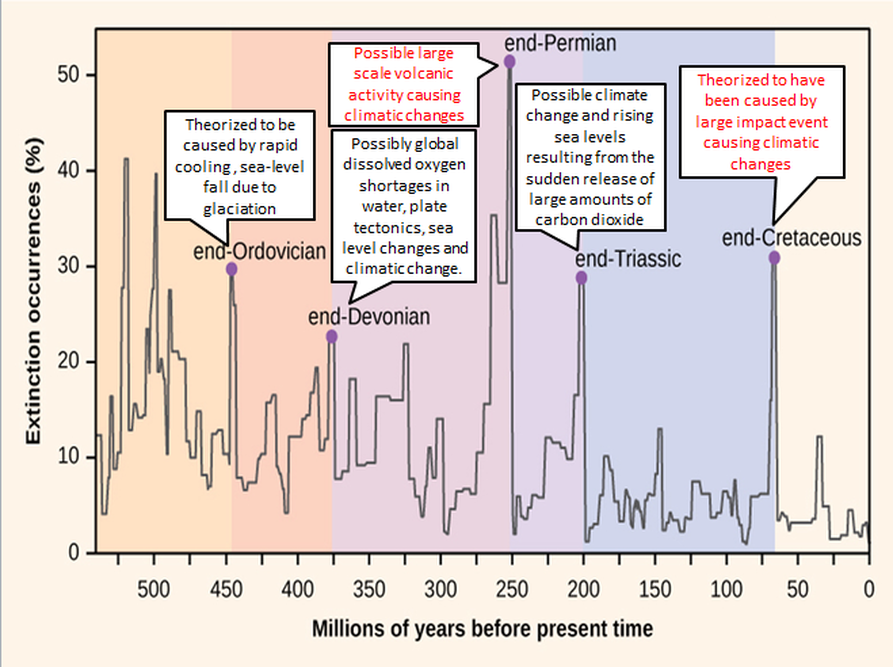
If you look at the diagram at the top of the post, you will see that climate change is a factor in all of the mass extinctions. Climate change has many causes. Two causes that led to mass extinctions were extensive volcanic eruptions and meteorite impacts, both of which can have global impacts by spewing large amounts of CO2 and other destructive compounds into the atmosphere and ocean.
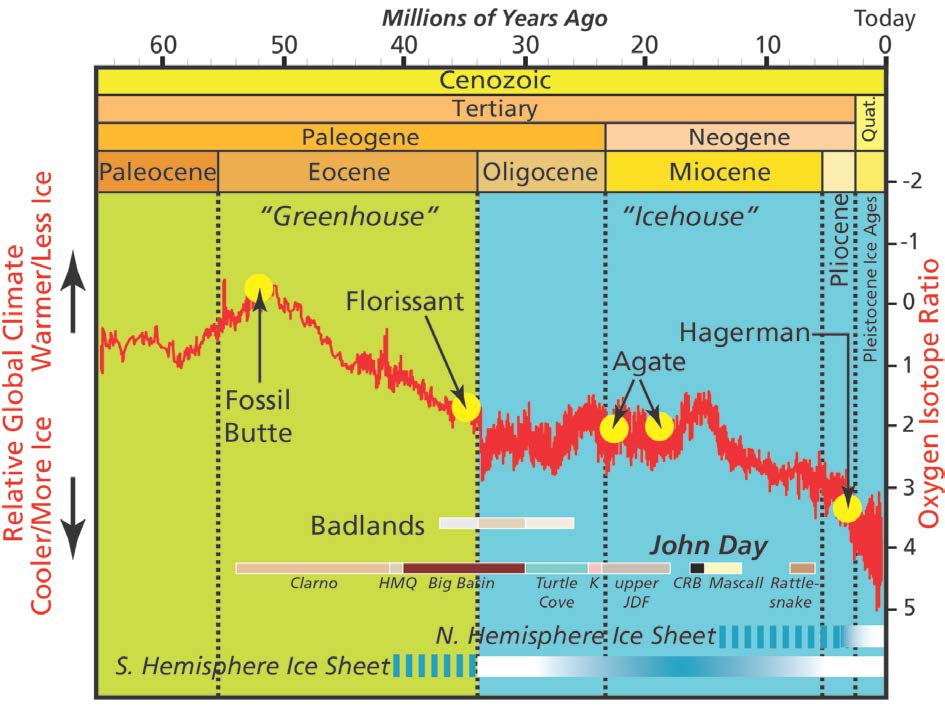
The named yellow circles on the red line are National Park Service locations with important fossil assemblages (e.g., Fossil Butte). Below the red line are bars showing the extent of time represented by sedimentary sequences in the Badlands of South Dakota and the John Day Fossil Beds of Oregon. This diagram emphasizes John Day’s importance, given the long period of time recorded there. The John Day bar shows formations (Clarno, Mascall, Rattlesnake), members of formations (HMQ=Hancock Mammal Quarry, Big Basin, Turtle Cove, K=Kimberly, upper JDF=upper John Day Formation), and the Columbia River Basalt Group (CRB).

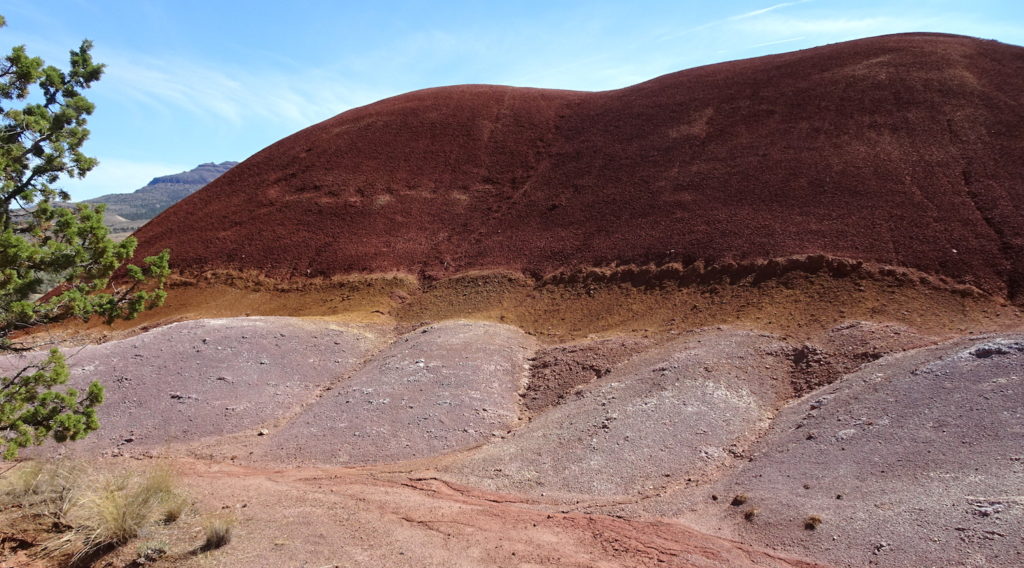
The best place to see paleosols is the Painted Hills location (see past post: https://landscapes-revealed.net/john-day-fossil-beds-national-monument-stratigraphy/). The photo above, from the Painted Hills, shows the top of the Clarno Formation—purplish, highly-weathered lava flow in the foreground—overlain by the base of the Big Basin member of the John Day Formation—deep red layers on the slope. The red color indicates soil-forming processes in a wet, warm period that effectively oxidized any iron in the sediments. Weathering processes during these warm, wet periods could extend deep beneath the surface to create thick soils.


In addition to a cooling global climate, the rain-shadow effect produced drier conditions in the John Day region. During Clarno time, this region was near the coast and the Cascades did not exist. By Mascall time, the coast was much farther west and the Cascade Range of volcanic mountains had developed and were capturing much of the precipitation. So we now see much wetter conditions in western Oregon, but much drier conditions in eastern Oregon.

This image, from the Thomas Condon Visitor Center, shows an example of how animals evolved to adapt to changing climate conditions. As the climate cooled and dried, it could no longer support lush forests and extensive grasslands took their place. Grasses are a gritty food item with hard particles that wear down tooth enamel. The image shows how horses evolved different leg types and high-crowned molars that continued to grow during their lifetimes. Other herbivorous mammals, such as rabbits, rodents and elephants, developed specialized teeth that enabled them to munch on grasses.
Other activities in the John Day region
My three posts about the John Day region have focused on the three locations that make up the John Day Fossil Beds National Monument. Here are two other activities to consider while in the region.


Useful reference
John Day Fossil Beds National Monument – National Park Service (NPS) Geologic Resources Inventory Report, by John P. Graham (2014): http://npshistory.com/publications/joda/nrr-2014-846.pdf